

Note: see new section on Fuel Comparison: 2022 vs 2023.
Our Zuba heat pump (PVA-A36AA7 + PUZHA36NKA) was installed in the summer of 2022 replacing a 95% efficient 18 year old natural gas furnace and a Trane air conditioner. We also replaced a natural gas hot water tank (low efficiency with chimney) with an electric hot water tank.
So far we really like our Zuba but we found that the documentation on how it works is sparse. This website is an attempt to describe how it works in our house supported with data collected on temperatures and power consumption in the fall 2022. The focus will be on the heat mode of operation. (Cooling works great too!)
Caution: This document is pretty detailed. Some people may find this pretty dry reading.
We installed a Zuba Cold Temperature P-Series heat pump (PVA-A36AA7 + PUZHA36NKA) with auxiliary electric heating coils and air handler. It is a 3 ton and is spec.'d at 38,000 BTU/hr down to -15C outside temperature. 80% of that down to -25C. Each of the two heating coils deliver 7.5kW (25,500 BTU/hr ea.) when activated. (see spec page .)
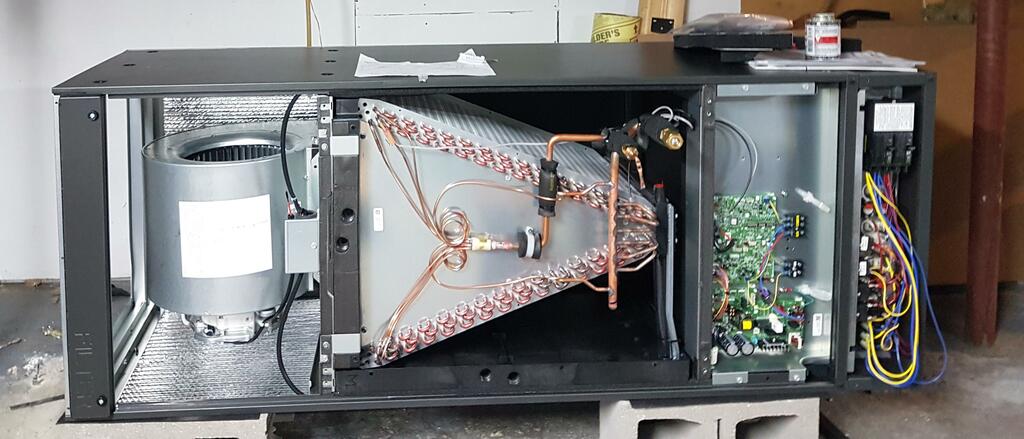
Air Handler
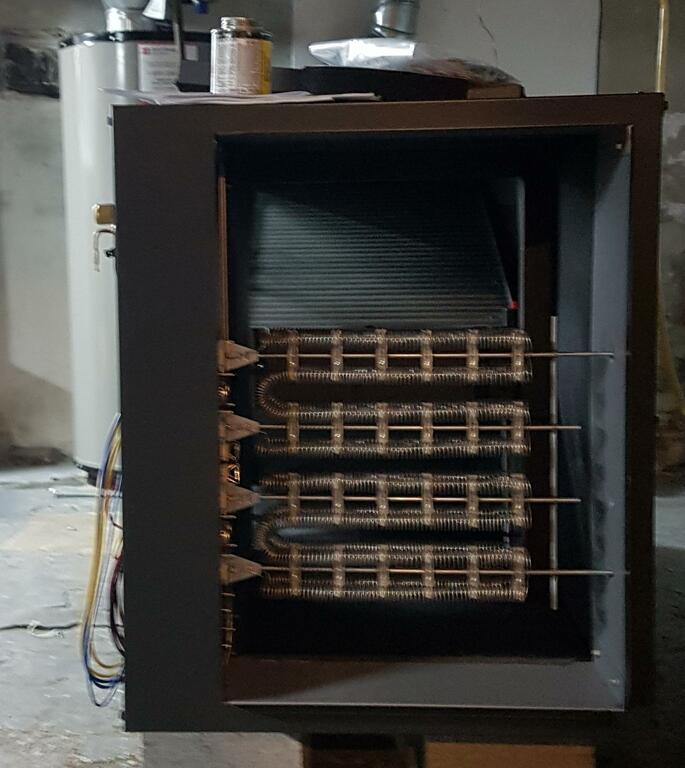
Heating Coils H1 and H2
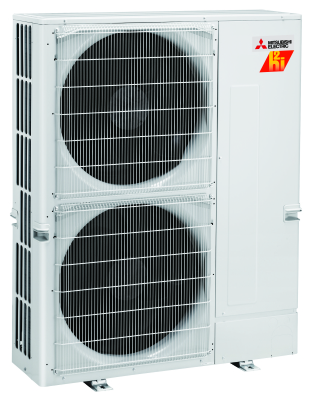
Outdoor Unit
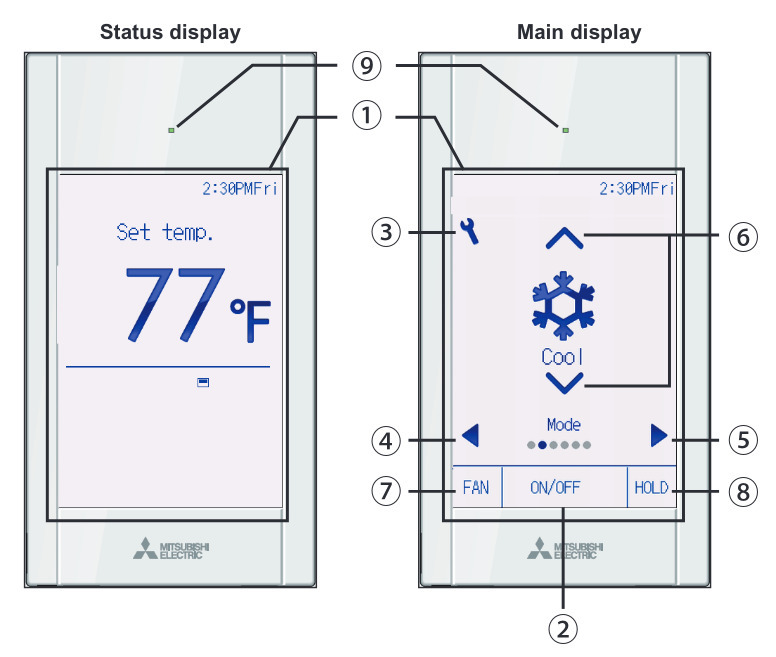
Controller
The temperature control unit is small, simple and easy to read. It lets you set fan mode, heat/cool mode as well as target temperature (To) set point. You can easily see current temperature (Tc) as measured by sensor in the unit and set 'hold mode' - over riding any scheduled setback programs. All is good until you set up a setback schedule and that is when the user interface is poor - but adequate.
We put our controller in the hallway which is central to house and away from heat sources and vents.
The Zuba room temperature measurement comes from the sensor in the controller (Tc - bottom right corner).
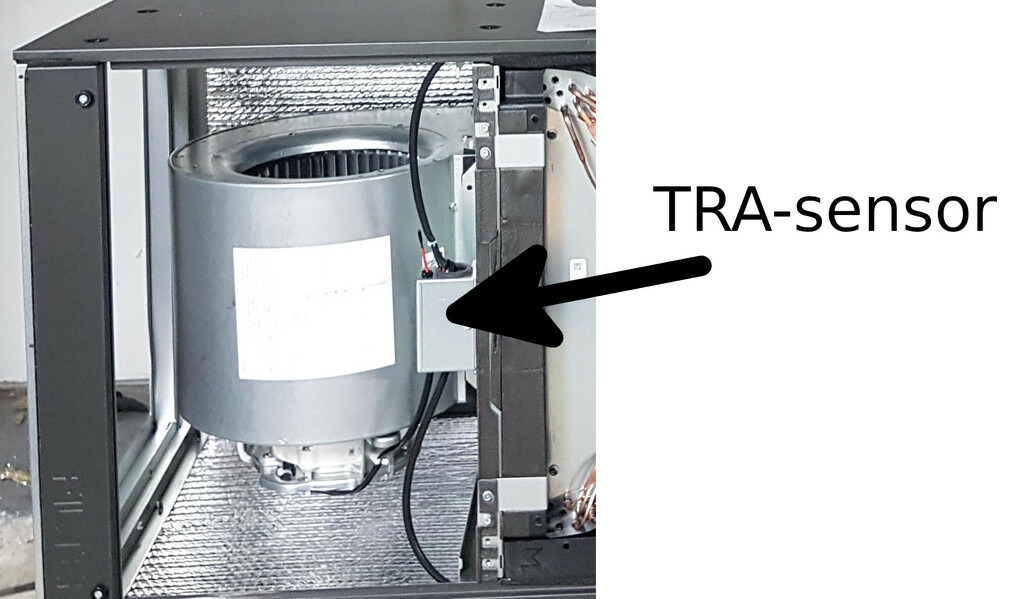
TRA - Return Air temperature sensor
Another temperature sensor is built into the air handler in the fan box and is used to decide when to enable the auxiliary heating coils. It is called the Return Air Sensor (TRA).
There are other sensors in the outside unit to decide when to go into a defrost cycle as well as a sensor in the heat exchange coils in the air handler. There may be others.
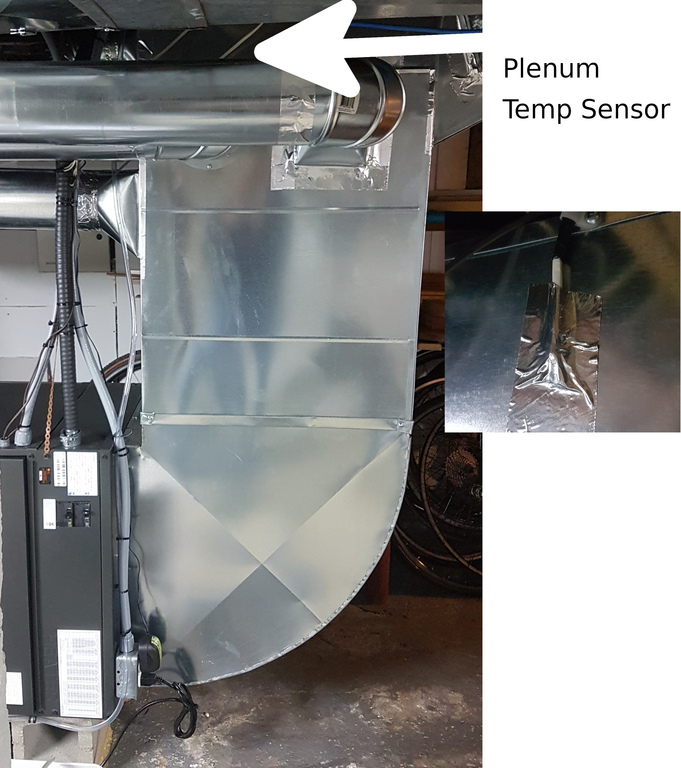
Plenum Temperature Sensor
(exit air temp.)
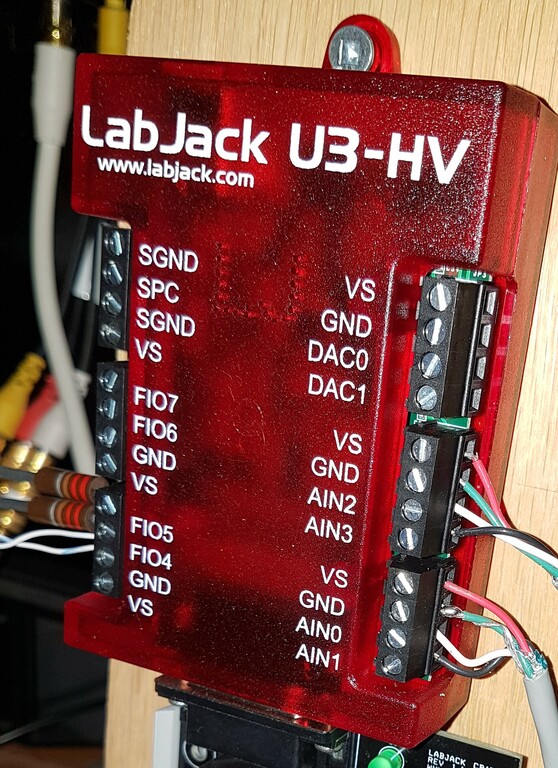
Labjack data logger
To better understand how the unit works, a temperature data logger was added to measure outside temperature, temperature of plenum close to the outlet air, temperature in the hall close to the controller and temperature in the coldest room with the Jotul. All measurements recorded and averaged to once every two minutes then combined with hourly power consumption data from our utility company.
The following images describe how the Zuba controls the H1 and H2 heating coils based on different TRA (return air temperature) and To (set point) scenarios. These images are from page 21 and 22 of the P Series Service Manual (item 1.3 on spec page). Click on images to open for zoom.
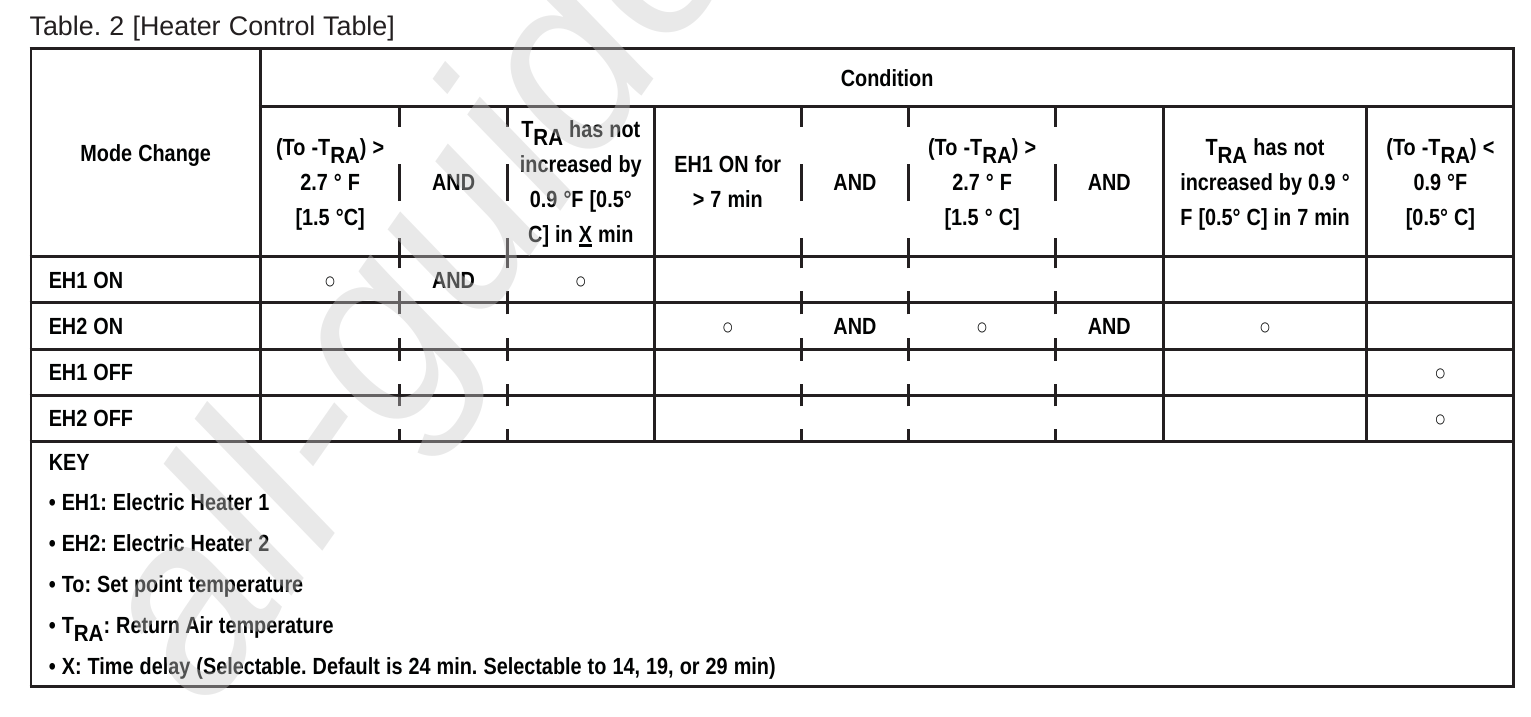
Logic table H1,H2 activation sequence - p21 (click on image to open)
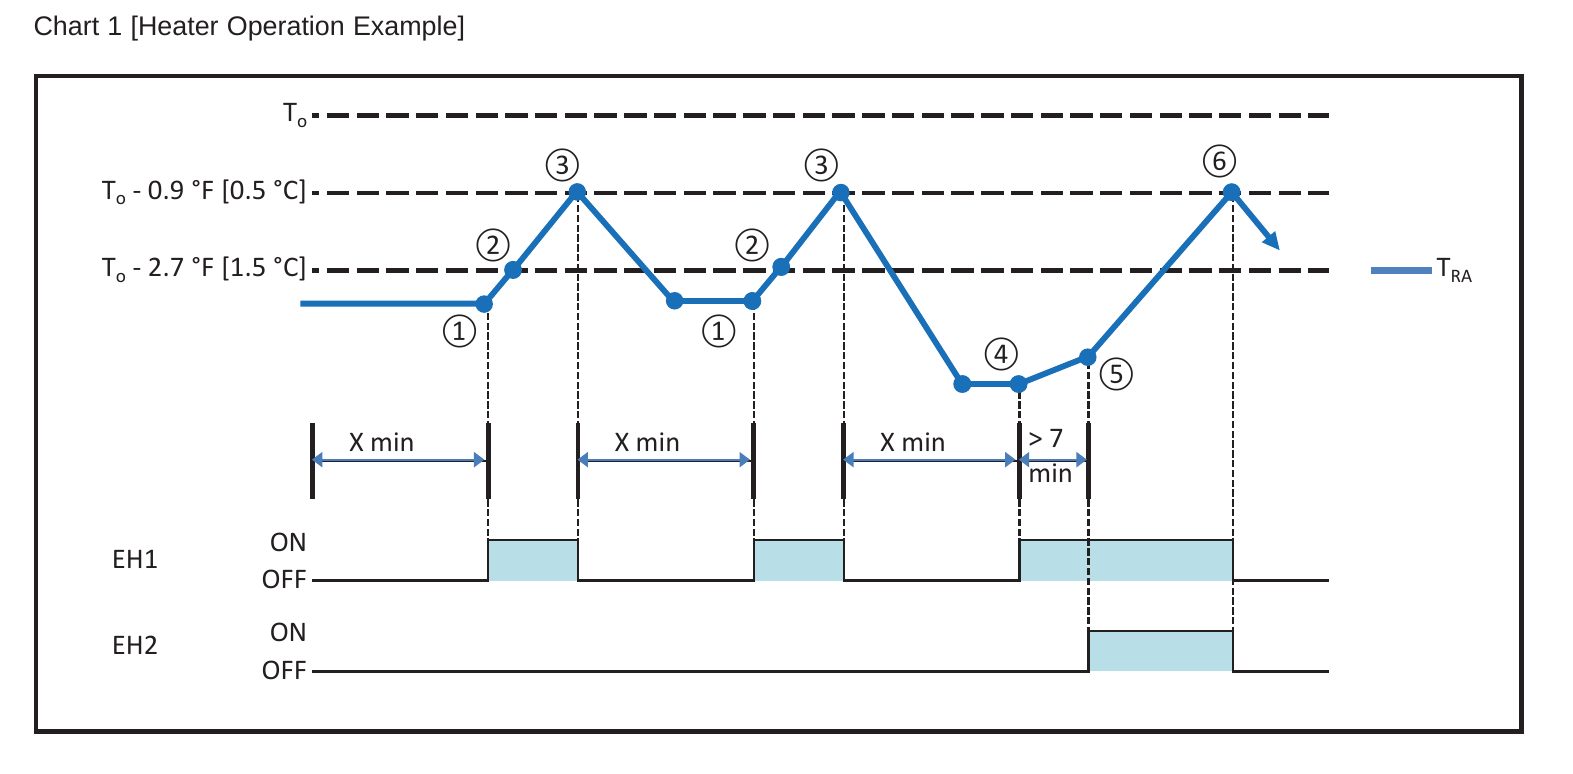
Graph showing H1, H2 activation sequence - p22 (X = 24 minutes) (click image to open)
The simplest way to operate this unit is to set the desired temperature of your house with no temperature setbacks and let Zuba do the rest. This is what will happen:
If you never adjust your set point temperature by more than 0.5C, you probably will never see the electric heating coils come on unless the heat pump can't produce enough heat when the outside temperature is very low (below -15C?).
If you program a setback to reduce the temperature in the house at night, you will likely see the electric heating coils activate when the setback is removed in the morning.
In our case, we decided to set the temperature at 21C during the day and at 9PM schedule a setback to 19C for sleeping. We decided to start ramping the temperature up at 5AM to 20C and then 6AM to 21C in the hopes that the house would get to 21C by 7AM when electricity rates go from the lowest rate to the highest rate. We did not want the heating coils coming on so we flicked the breakers off to save more energy and tolerate a longer return delay to a house temperature of 21C.
Note: If you don't want the heating coils to come on, you can turn off the heating coil breakers (H1 and H2 .. see photo below). If you are not worried about freezing pipes or are always present in your home, you can turn on H1 or both H1 and H2 when you realize the heat pump is not keeping up with the set point ... or if you want your system to respond faster to changes in set point. You can also install a low temperature electric coil controller - see Electric Heater Lockout later in this document.
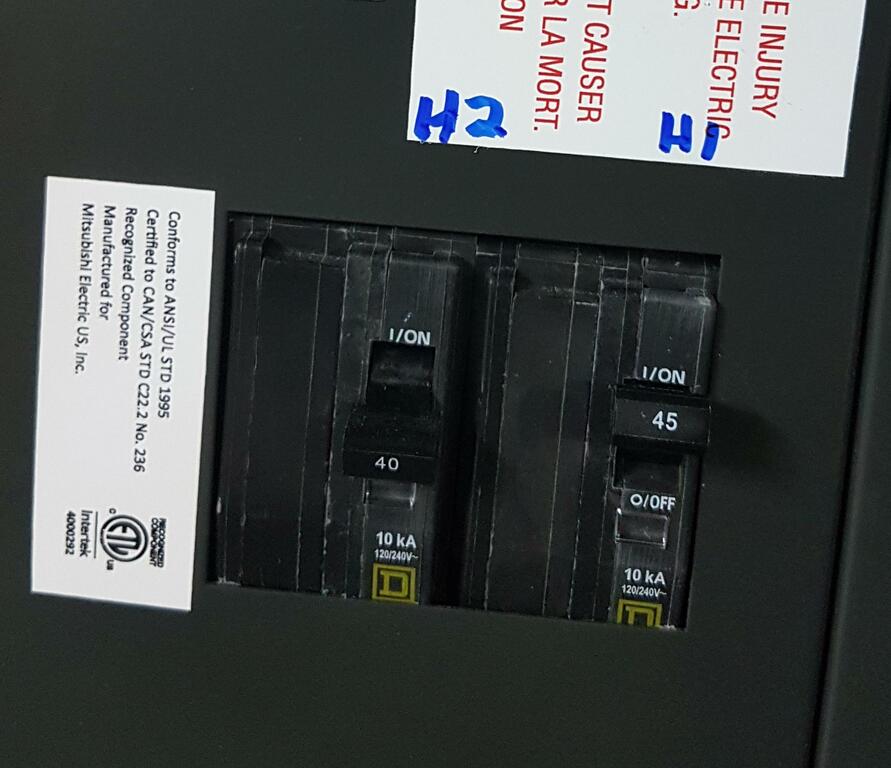
H1 and H2 breakers
Note: H1 is larger capacity because in some installations the fan is on this circuit.
At first I thought that Energy Save was how to manage the activation of H1 and H2 heating elements .. but I soon learned this is not so.
Energy Save Mode, from what I can understand, is a way of limiting the heat pump power consumption during periods of the day when the cost of energy is high. It has no knowledge of H1 and H2. I was also told it only works in Cool mode not Heat mode. I'm not sure that's true .. but it certainly does not know anything about H1 and H2.
The Controller Instruction Book on page 24 is probably the best place to look .. bottom of page. ( See item 6.2 : spec page) I think there is another place that talks about the percentage being of the rated capacity of the unit. Yes you can set 0% and shut the unit down.
Someday when I have too much time on my hands I'll make measurements on this.
If you decide you want to use setback programming to lower the temperature of the house at night, you may want to disable the heating coils from coming on in the morning .. provided you can accommodate the slow return to your day time target temperature. (It can easily take an hour to raise the house temperature by 1 degree C.)
The caveat to this is if the outside temperature is low enough to make this recovery time excessively long or perhaps even impossible. In this case you will want to enable at least one if not two of the heating coils.
The solution is of course to live in your house and know when it will need the heating coils based on outside weather and simply flick the breakers on.
The other way is to install a controller that measures outside temperature and decides when you will need to enable H1 and H2 to keep the house warm. Mitsubishi has an add-on you can install to do this and it is described in the Electric Heating Lockout section (5.0) of spec page.
The Mitsubishi Lockout solution uses a Ranco 2 stage controller with an outside sensor. You can set the temperature that enables H1 and a further (lower) temperature that enables H2.
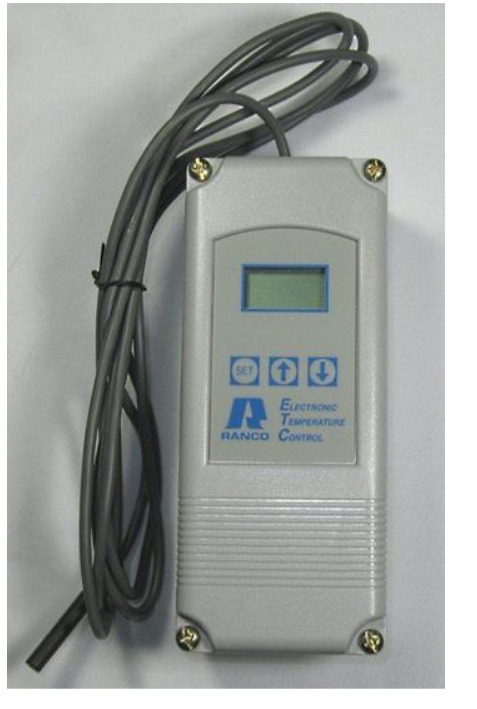
Ranco - 2 stage controller
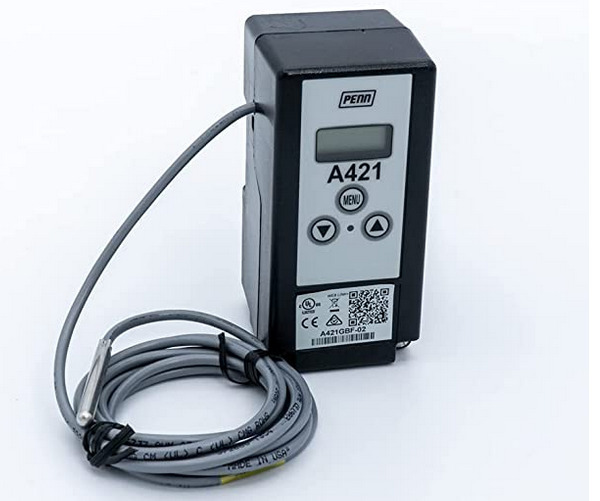
Penn - by Johnson Controllers
I'm sure this Ranco controller is good but we decided on the Penn Controller made by Johnson Controls. They only offer a single stage controller but we decided that we could enable both coils and let Zuba make the decision on when to enable H2 (7 minutes after H1 if no change in in-take temperature TRA). We added a relay to enable both H1 and H2 and selected the 24VAC version so we could share the humidifier transformer and keep the wiring all low voltage. You will see these items in section 5 of the reference documents.
Of course with this solution we can also keep the H2 breaker off to restrict the heating boost to 7.5kW (26,000 BTU) if we want.
We programmed it to enable the coils at -15C and disable coils when temperature rises to -12C. We are waiting for some cold days to monitor temperatures to watch this happen!
Note: I don't provide a circuit diagram because if you need one then you should probably not be doing this upgrade yourself. Ask your dealer to install the Mitsubishi solution.
Finally, there is the humidifier to consider. In our case we re-installed the flow-through unit from our previous furnace but held back on the wiring to see if we really needed humidity in the winter. We decided we DID need some humidity and so we wired the unit up with just the humidistat controlling when to turn on the water solenoid with no Zuba control board connection. We decided this was OK because the fan is running at low speed most of the time and the heat pump comes on frequently as the outside temperature drops - so there should be enough air flow to humidify the house.
Mitsubishi has an add-on (CN24RELAY-KIT-CM3) to work in conjunction with the heating system (to set fan on high when the humidistat turns on). It is described on page 25 of the PVA Installation Manual. ( See item 1.1 : spec page)
So far, our humidifier is working without the relay kit and is meeting our target of 35% relative humidity.
As stated earlier, we installed some temperature sensors around the house and collected temperature readings to better understand how the unit works.
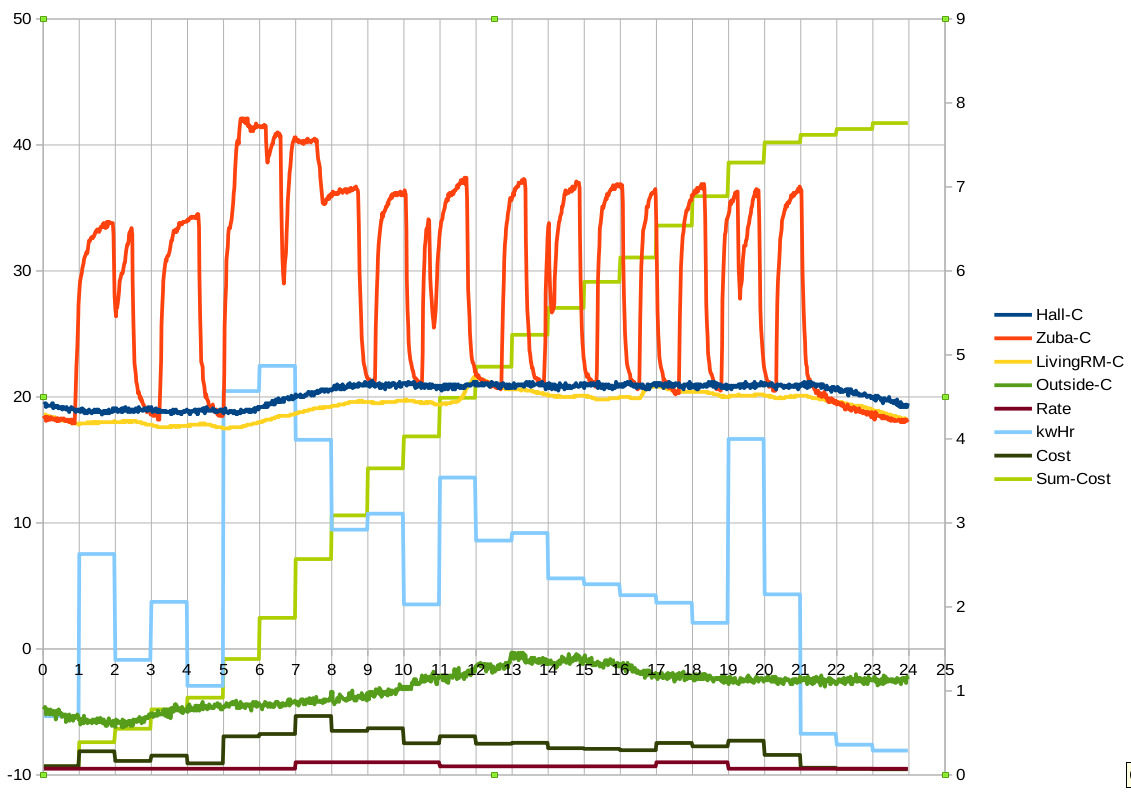
Graph #1: 2022-11-18 - heating coils off - 9PM setback (click on graph to open for better look)
In the first graph (Graph #1 above) both H1 and H2 heating coils are off and the temperature sets back to 19C at 9PM and returns to 20C at 5AM and 21C at 6AM.
This is what you can observe:
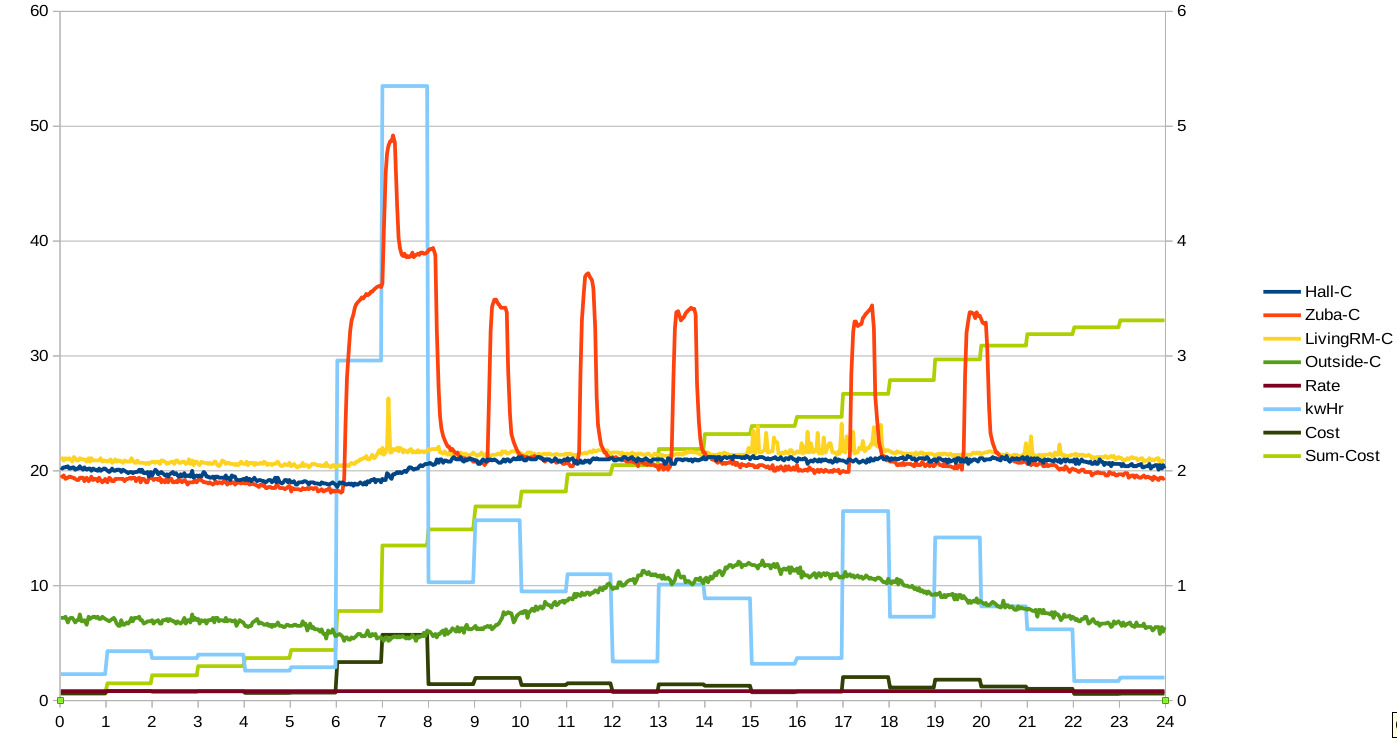
Graph #2: 2022-11-18 (click on graph to open for better look)
This next graph (Graph #2 above) was in October 2022 with H1 and H2 enabled. Outside temperature was much warmer as you can see and in this case the set point was returned to 20C at 6AM and 21C at 7AM (from a 19C setback at 9PM). (The living room temperature sensor has a problem so ignore).
This is what you can observe:
It took quite a bit of digging to find the P-series Specifications ( See items 3.1 and 3.2 : spec page) document and home in on the model combination we purchased (page 47). The M-Series Spec. was easier to find and talks about COP factor .. but the P-Series is a little newer and the M-Series is obsolete.
COP is the Co-efficient of Performance and is the units heating capacity (power output) divided by the power input. Of course you need to convert BTU/hr to watts to keep the units consistent. (3.41 BTU/hr is equal to 1 Watt)
The Learning Metrics Website ⇗ website has an interesting graph on a typical heat pump as seen below:
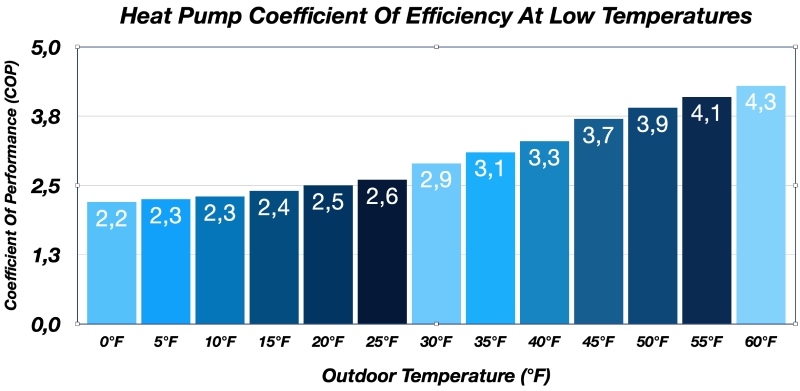
A Typical Heat Pump Coefficient of Performance graph
So let's see if we can generate a similar COP graph for our heat pump. With some cut-and-paste of page 47, we have a spreadsheet with COP calculation based on the Max Q/W (not Rated column - see note 1).
It is interesting to graph these numbers to see how they compare with the 'typical' performance curves from Learn Metrics. You see (below) that there are 3 families of curves for Q, COP and W for each of the three room temperatures of 25C, 20C and 15C. The right Y-axis is for the COP curves and the center Y-axis doubles for Q (BTU/hr) and W (Watts). Of course the bottom X-axis is outside temperature. (Click on graph to open up in larger window!)
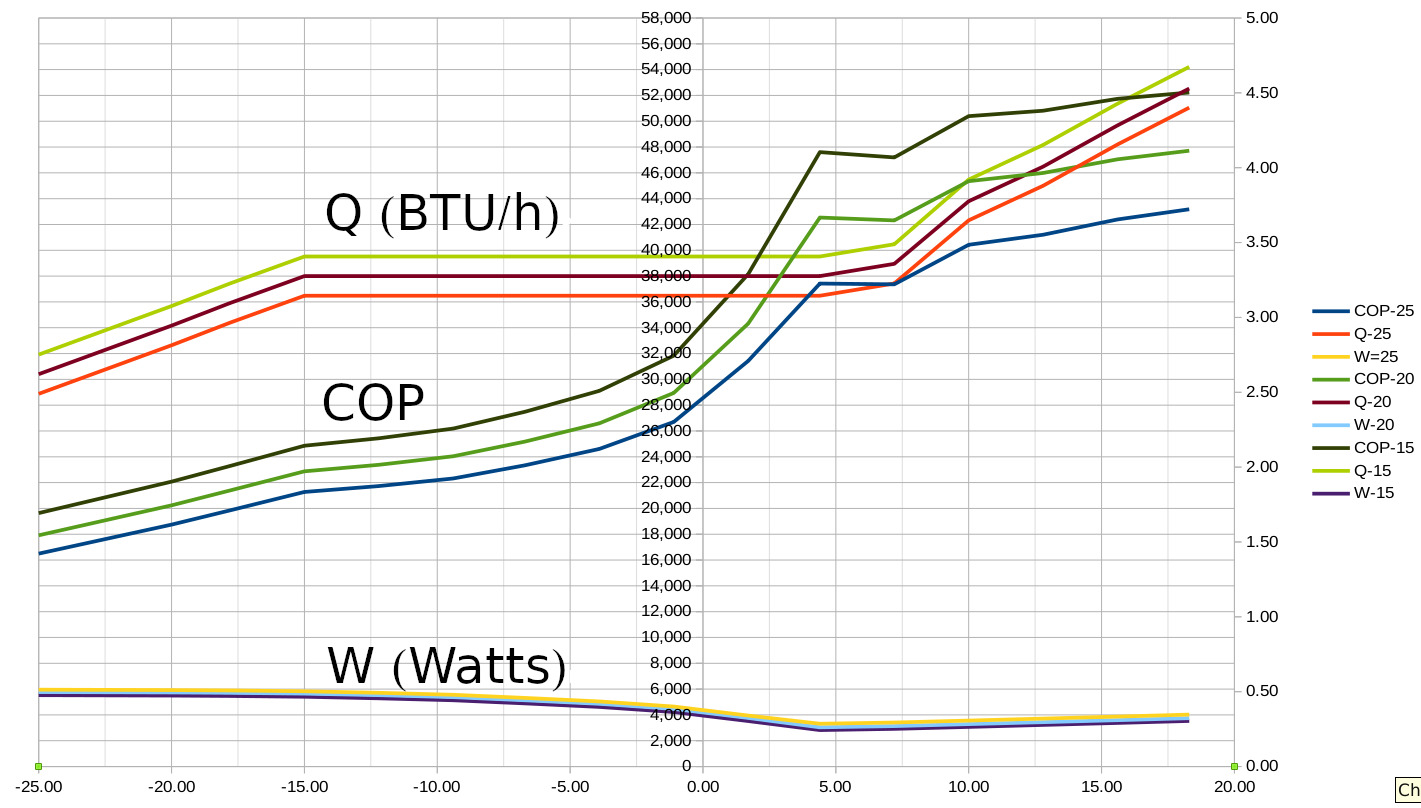
Heating Mode Spec. PVA-A36AA7/PUZHA36NKA (click on graph to open for better look)
So let's see if we can interpret these curves. The Q (BTU/hr) curves seem somewhat fabricated giving a flat section from +5C to -15C (outside temperature. The 20C room temperature line is on the 38,000 BTU/hr spec of the heat pump and it 'degrades' nicely to 30,000 BTU/hr on a straight line to -25C which is conveniently 80% of 38,000 BTU/hr. This fits the published spec of the Zuba unit perfectly.
Take at look at the W (Watts) input curve and you can see the power consumption of the unit is 3000 W at +5C outside temperature which gives you a COP of well over 4 which is great. The unit then requires more and more power to follow the Q line until it reaches 5600W at -15C (COP=1.83) and then 6000W at -25C (COP=1.42).
With a COP of 1.45 at -25C, it is still better (in theory) to run the heat pump over the heating coils (COP=1.0) indicating it is providing 1.45W output for every 1 W of input.
What is somewhat surprising is that the COP curve looks so twisted when compared to the Learn Metrics example. I suppose we have to remember that the Zuba is not a traditional heat pump and has no compressor. My guess is that the firmware running the unit is making a lot of decisions to squeeze out as much efficiency as it can resulting in a not-so-pretty curve.
With the data we are collecting on inside and outside temperatures, we should be able to see how close we come to the theoretical power consumption based on the COP data spec over this winter ... and compare it to our utility bill.
The bottom line is, how does the 2022 season compare to 2023 after installing the Zuba heat pump?
We got quite a few people saying we were going to regret converting and that our energy costs were going to go sky-high. Fortunately they were wrong and in fact (spoiler alert) we came out almost 'at par' comparing natural gas with the cold temperature heat pump from Mitsubishi. Note however that 2023 was a much warmer winter compared to 2022 and the Zuba looses it's efficiency below -15C.
Here is the data as collected from Ottawa Hydro and Enbridge bills with analysis. A table of definitions follows.
Note: In Ontario, and probably many provinces in Canada, the term 'Hydro' means 'Electric Power' which historically has been hydroelectric power. In Ontario, a large percentage of power generation is nuclear power (54%) , hydroelectric at 26% and natural gas and wind generation at about 10% each (as of spring 2023).(See ieso.ca ⇗)
| line# | year-end 2022-06-04 | year-end 2023-06-04 |
||
|---|---|---|---|---|
| 1 | Natural Gas cu m: | 2218 | 234 | |
| 2 | Natural Gas MMBtu: | 81.84 | 8.63 | |
| 3 | Natural Gas GJ: | 86.26 | 9.10 | |
| 4 | Natural Gas Billed (excluding monthly fee of $27): | $891 | $117 | |
| 5 | Metric Tons of CO2(from NG): | 1.18 | 0.12 | |
| 6 | Hydro KW-hr: | 4746 | 11785 | |
| 7 | Hydro MMBtu: | 16.19 | 40.21 | |
| 8 | Hydro GJ: | 17.07 | 42.38 | |
| 9 | Hydro Billed (excluding monthly fee of $31): | $572 | $1,428 | |
| 10 | Metric Tons of CO2 (from Hydro:10% NG): | 0.02 | 0.06 | |
| Totals: | ||||
| 11 | Total Energy (GJ/year): | 103.33 | 51.48 | |
| 12 | Total CO2 metric tons: | 1.20 | 0.18 | |
| 13 | Total Cost (Energy + delivery): | $1,463 | $1,545 | |
| 14 | Total Cost with fixed monthly fees: | $2,159 | $2,241 | |
| Climate Data: (Ottawa Airport) | ||||
| 15 | Heating degree days: | 4389 | 3957 | -10% |
| 16 | Cooling degree days: | 245 | 320 | 31% |
| 17 | # days below -25C: | 9 | 2 | |
| 18 | # days below -15C: | 47 | 19 | |
| Green Energy Evaluation: | ||||
| 19 | before then after upgrades: | 167 GJ/yr | 99 GJ/yr | |
| 20 | Stated Potential: | 88 GJ/yr | ||
| 21 | Calculated Heat Load: | 12.7KW | ||
Most of these Mitsubishi documents were downloaded from https://mylinkdrive.com/ ⇗.
photos by Harold Blount - Copyright © 2007-2025
hb at nordicwind dot ca
legal
